
Tax Myths Debunked
In light of the most recent round of naysayers, let’s debunk some myths about Rich States, Poor States. Contrary to what some believe, the Rich States, Poor States Economic Outlook rankings and the Laffer Curve help clarify the relationship between taxes and prosperity.
At the heart of Rich States, Poor States, is the Laffer Curve. Made famous by Dr. Arthur B. Laffer, it examines the relationship between tax rates and tax revenue. Specifically, the Laffer Curve shows that tax rates and tax revenue do not have a linear relationship, as shown in the chart below.

Looking at the Laffer Curve, at a tax rate of 0%, the government collects no revenue, no matter the size of the tax base. At a tax rate of 100%, the government also collects no revenue because no one would choose to work if 100% of their income was taxed. It also shows that governments can earn the same amount of revenue at two points on the curve: a high tax rate on a small tax base and a low tax rate on a large tax base.
When tax cuts are considered, policymakers must consider the size, timing, and location of tax cuts. Size matters because the higher the tax rates are, the greater the economic impact of a given percentage reduction in tax rates. Timing matters because lower expected tax rates in the future will reduce taxable economic activity now as people shift their work until the later period when they will be taxed less. Location matters because people will compare the tax cuts in their state to tax rates in neighboring states.
Debate occurs over where we are along the Laffer Curve. Some economists have confirmed Dr. Laffer’s findings that the timing of tax cuts affects the shape of the Laffer Curve. A 2012 study claims that the Laffer Curve’s tipping point for federal labor taxation and federal capital gains taxation are roughly 60% and 70% in the U.S., respectively.
This doesn’t mean that policymakers can continue to jack up tax rates without any fear of repercussions. As noted by Economist Dan Mitchell, the same 2012 study implies that the government would reduce private-sector income by about $20 for each $1 of new labor tax revenue. Raising federal capital gains taxes from 40% to 70% would generate a less than 10% increase in capital gains tax revenue. As Mitchell notes, increasing taxes to this supposed tipping point would yield small revenue gains and destroy the private sector in the process. These tax increases would just be bad policy.
While the jury’s still out on where the tipping point of the Laffer Curve is, it is easy to tell when a state has taxed too much. When people get tired of being taxed, they move out of state. The latest migration data from the IRS as well as data from U-Haul and United Van Lines show that Americans are leaving higher tax states in the Northeast and California for states such as The Carolinas, Florida, Idaho Tennessee, Texas and Utah.
It is also important to note that North Carolina, Florida, Utah, and Idaho were in the top 10 states for Economic Outlook for Rich States, Poor States (Texas was number 11 and Tennessee was number 13). On the other hand, California, New Jersey and New York consistently find themselves in the bottom 10 states for Economic Outlook. Also notice that states like Massachusetts, Oregon, and Vermont are seeing some in-migration despite poor Economic Outlook rankings. This gets back to Dr. Laffer’s point about location. Sure, tax rates are not great in these states, but when you have neighbors like California, Connecticut and New York, taxpayers will see your state as the more affordable alternative.
If that simple correlation isn’t enough, we did some further analysis. The figure and table shown compares the relationship between the ALEC-Laffer Rich States, Poor States Economic Outlook rankings with state economic health indices from the Federal Reserve Bank of Philadelphia. Because the Philadelphia Fed indices are single measures (comprised of multiple factors), they can easily be ranked and compared with ALEC-Laffer rankings. The chart shows the association graphically between the policy rankings presented in the 2017 edition of Rich States, Poor States and the actual performance of the 50 states in 2017, 2018, 2019, 2020, 2021 and 2022 (as of April). The positive association is obvious from the chart.
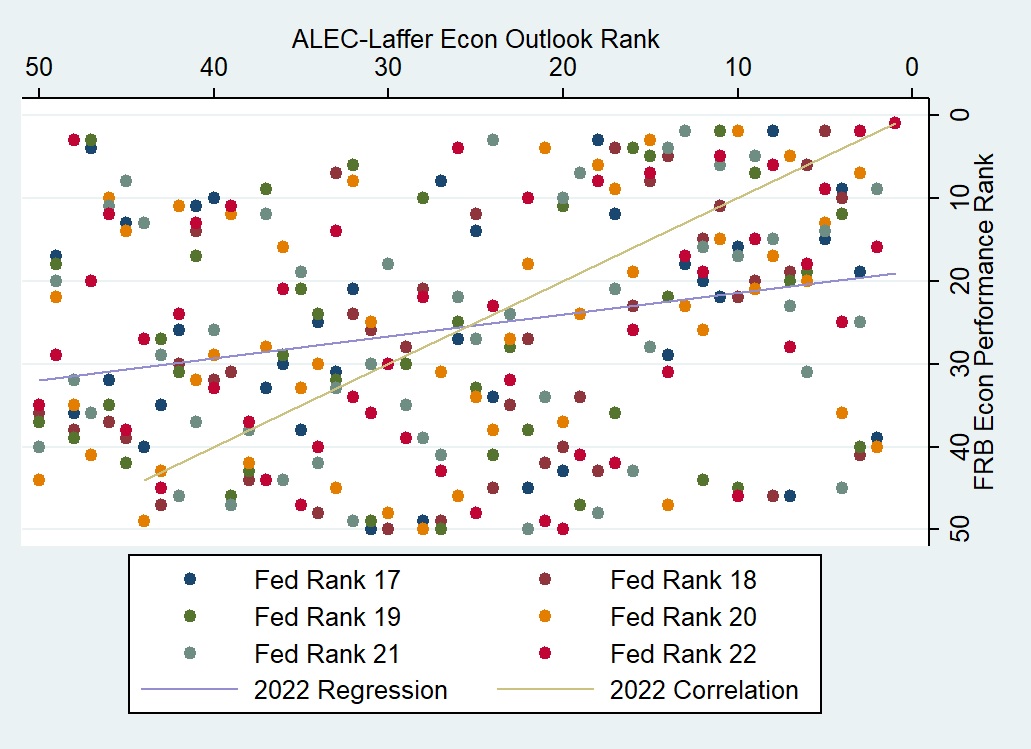

The table shows a more statistically sophisticated test, measuring a special type of correlation when one is studying ranks (the so-called Spearman Rank Correlation). This properly measures the correlation between the ALEC-Laffer state policy rankings and the Philadelphia Federal Reserve’s state performance rankings. In this case, the correlation is presented for years contemporaneous with the Rich States, Poor States publication as well as one, two, three, four, and five years afterwards (to the extent the future years have occurred).
Our findings, in plain English, are:
- There is a distinctly positive relationship between Rich States, Poor States Economic Outlook rank and subsequent state economic health.
- The formal correlation is not perfect (i.e., it is not equal to 100%) because there are other factors that affect a state’s economic prospects.
Any economist worth their salt would concede point two. However, the ALEC-Laffer rankings alone have a 26% to 45% correlation with state performance rankings. This is a very high percentage for a single variable considering the multiplicity of idiosyncratic factors that affect growth in each state such as resource endowments, access to transportation, and ports and other marketplaces.
So, the next time someone tries to tell you Rich States, Poor States is fake news, don’t believe them. While no one has a crystal ball when it comes to policy, learning from Rich States, Poor States could make the difference in your state following in the footsteps of Utah or New York.