
Americans Are Voting With Their Feet
This annual release from the Census Bureau is an important reminder of how the economic policy levers controlled in state capitols impact economic opportunity.
Earlier this year, the Census Bureau released updated estimates on state population change and, perhaps most importantly, net domestic migration. Over the past 18 years, the Rich States, Poor States: ALEC-Laffer State Economic Competitiveness Index has established a relationship between economic policy and how Americans “vote with their feet.” In this newsletter, I’ll break down some of the key statistics to highlight the lessons from migration trends through July 2025.
First of all, the new data shows North Carolina emerged as the top destination, gaining over 84,000 residents on net from the rest of the country. For decades, either Florida or Texas has been the top state, and this year represents the result of a remarkable turnaround in North Carolina. In 2011, the state ranked 26th in Economic Outlook in Rich States, Poor States. Since then, it has joined the flat tax revolution and set its corporate income tax on the path to elimination. The state now ranks 4th in Rich States, Poor States, and has gained hundreds of thousands of new residents through in-migration in recent years. For 2025, it is followed by Texas, South Carolina, Tennessee, and Arizona as the other states seeing the most in-migration.
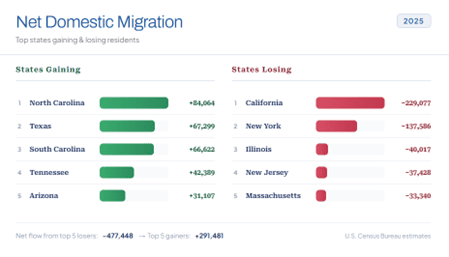
At the opposite end, California, New York, and Illinois have lost the most residents through domestic migration. The Golden State is now in its fifth consecutive year with the largest net outmigration. From July 2024 to July 2025, California lost 229,000 residents to other states. Taking a longer-term view amplifies the importance of migration in state economies: Over the 10 years ending in July 2025, California is estimated to have lost nearly 2.3 million residents to the rest of the country. In New York, that number is nearly 1.9 million, and in Illinois, just over 900,000.
Where are all these Americans going? Well, some probably end up in the top states gaining from domestic migration: Over that same 10-year period, Florida had in-migration of 1.2 million, Texas of 1.2 million, and North Carolina of about 750,000.
Of course, the biggest states might be expected to have the biggest migration numbers. By scaling net migration relative to population, we can get a sense of where migration is having the biggest impact. Using state populations from 2025, we can calculate total domestic migration since 2010 as a share of population.
In this measure, South Carolina comes in as the top in-migration state, with net migration equal to about 12% of the state’s population. Idaho is a close second at 11.6%, followed by Nevada, Arizona, and Florida, all above 9%. On the losing end, New York (which has ranked 50th in Rich States, Poor States every year since 2014) saw net outmigration from the state from 2010 to 2025 equal to about 12% of its population, followed by Alaska at 10.8% and Illinois at 10.1%.
The latest data through July 2025 also shows new trends developing in some states. Ohio shifted from a net outmigration of about 2,500 residents in the previous year to an in-migration of nearly 12,000. Prior to 2025, Ohio had seen outmigration every year since the 1980s. Michigan, with a similarly consistent outmigration pattern, also saw in-migration for the first time in decades. Colorado, meanwhile, had been a consistent in-migration state since 2004, yet saw this reverse to outmigration of about 12,000 residents for the 12 months ended July 2025.

All of this amounts to some interesting regional breakdowns. The South remains exceptionally competitive, home to some of the nation’s top destination states. Louisiana and Mississippi, however, struggle to compete with their neighbors and remain outmigration states. In the West, most states are gaining from migration. Even Oregon and Washington—where fortunes have been mixed since the pandemic—both saw in-migration in this latest data. The pace of Californians’ departure has improved the economic fortunes of the state’s neighbors.
Colorado, as mentioned above, saw outmigration, as did New Mexico. Their more competitive Mountain neighbors, however, continue to be consistent in-migration states. The Dakotas also continue to see in-migration, while their Plains neighbors to the South lose residents.
The Northeast remains the nation’s economic black hole, at least as far as migration is concerned. When Americans vote with their feet, they indicate that the Northeast is the most consistently uncompetitive region. New Hampshire, Maine, and Delaware attract modest in-migration, but their neighbors generally export businesses, residents, and wealth to the rest of the nation.
This annual release from the Census Bureau is an important reminder of how the economic policy levers controlled in state capitols impact economic opportunity. Americans continue to vote with their feet, and the policies from Rich States, Poor States, including taxes, minimum wages, right-to-work policies, and others important to state economies, continue to play key roles in which states create opportunity and which see it leave in a moving van.