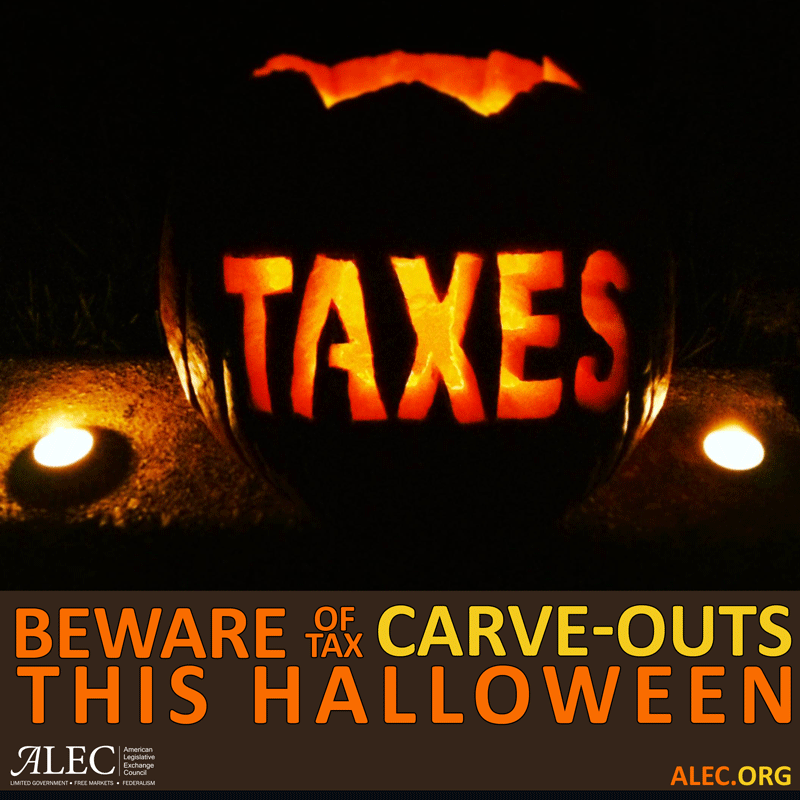
A Halloween Horror Story: Tax Carve-Outs Edition
This frightful affair begins with a simple and mundane request from a colleague of mine who manages ALEC’s social media. He wanted to create a meme for this great image and had a seemingly simple question: what is the total value of tax carve-outs on the state and federal level?
Carve-outs are the ghoulish tax preferences that allow people and companies to get special treatment from the government and avoid the tax burden that they otherwise would have had to pay given their income or spending levels and their tax rate. For all but the chosen few, carve-outs haunt those taxpayers who have to pay higher taxes as rates creep up to raise a given amount of tax revenue due to the partial or total exclusion of a small group of their fellow citizens from the tax rolls. More troubling, the worst of these credits can cause huge economic distortions which have a vampire like effect on economy’s ability to grow and innovate. Just like subsidies, tax carve-outs often mean government picked winners and loser of the politically favored or well connected, instead of the fair and even outcomes of market processes.
Unaware of the impending doom facing me in my quest for what should be easily obtainable information, I told my colleague “no problem.” After all, the Joint Tax Committee and Treasury both post a measure of all of the tax carve-outs (they use the awkward and problematic term “tax expenditure”) on the federal level—why would such a thing not be available from each and every state for each and every year?
Despite my initial self-assured disposition, a panic quickly began to set in. As I dug deeper and deeper into the double digits of Google searches pages, and racked my brain for alternate search terms, the horrifying reality began to set it: this information might not be available. I frantically began calling up colleagues at other think tanks and even contacted a few public finance academics, and what I learned was absolutely blood chilling. No one seems to know or even have a good educated guess on the total value of tax carve-outs in all 50 states <cue the dramatic horror movie music>.
What we do know is that the federal government has total tax carve-outs of between $700 billion and $1.2 trillion a year, though a few things are included which almost certainly should not be considered carve-outs, like the capital gains rate, which is not really a tax preference. We also do know that some states do provide some data on tax credits, but there are many shortcomings. Some states only release their tax expenditure reports every two years or even less. Some states only include some carve-outs but not all, and many of those states don’t have a total figure available for all of their carve-outs combined. Some states simply don’t even publish a report.
The New York Times did have an interesting study which tried to calculate just business incentives offered by states and pegged them at $80.4 billion a year. Unfortunately, that study had problems because it included all business incentives, not just tax incentives, and incorrectly included exemptions of business-to-business transactions as an incentive when really those exemptions are just trying to ensure the tax base is correctly constructed from an economic perspective. Optimum tax theory clearly establishes that business-to-business transactions are to be excluded from the tax base to avoid the gruesome outcome of “tax pyramiding.” Moreover, it fails to look at all of the exemptions not related to incentivizing business activity, thus missing a big chunk of relevant information.
The problems with transparency are thankfully not a partisan or ideological issues, as both the Center for Budget and Policy Priorities and the Institute for Taxation and Economic Policy—“Freddy Krueger” like opponents of sound, pro-growth tax policy and frequent critics of ALEC—have both called for greater tax carve-out transparency. The Pew Center on the States has pointed out that the tax carve-outs often have no firmly stated and measurable goal, and are subject to no performance review of how well they are accomplishing their objectives even when one has been stated. The Tax Foundation has also highlighted this exact transparency problem with carve-outs, and separately points how out opaque state tax codes can be in a recent piece on transparency.
Here at ALEC, we have written (here and here) on the benefits of a “neutral, pro-growth tax code,” which is another way of saying that the tax code should be free of special preferences. ALEC’s Tax and Fiscal Policy Task Force has model policy outlining that state “tax expenditure” data should be transparent, should require measurable goals for tax carve-outs, and should measure annually how well carve-outs are accomplishing that goal. The model policy notes a few things that should not be considered carve-outs, which is worth noting:
- Deductions to arrive at income under an income tax.
- Exemptions of business inputs under a sales tax or gross receipts tax, thus avoiding taxing business-to-business transactions.
- Deductions or credits used to offset a discriminatory tax or fee.
- The lower rate on savings than traditional income present under many capital gains and divided tax codes.
For now, there is no happy ending to this story—just suspense. We can only hope that states take steps to open their books and thoughtfully analyze their tax preferences. Until then, we will be haunted by the absence of data and transparency.

