The joke’s on them: High-ranked states in ‘Rich States, Poor States’ perform better
This appeared on the Daily Caller April 16, 2014.
The 7th edition of Rich States, Poor States: ALEC-Laffer State Economic Competitiveness Index was released yesterday and has received attention from all angles. While most of the coverage has been positive, Business Insider’s Joe Weisenthal chose to call the index into question. His claim:
The American Legislative Exchange Council (ALEC) — an organization that pushes market reforms around the country — is out with its latest map of the most and least competitive states in America.
The map is silly. Dynamic economies like New York and California are ranked near the bottom, while un-dynamic economies like Indiana and Wyoming are ranked near the top.
Obviously ALEC is ranking states based on each state’s level of deregulation and awarding the most deregulated states, but the outcomes seem to have very little bearing in where companies actually want to launch and do business.
The index usually ranks states with excessively high tax rates and uncompetitive labor policies near the bottom of the list for future economic growth potential. Conversely, states with lower levels of taxation and competitive labor policies tend to rank very highly. This year is no different.
Overall Economic Outlook for 2014
| Top Ten | Bottom Ten |
| 1. Utah 2. South Dakota 3. Indiana 4. North Dakota 5. Idaho 6. North Carolina 7. Arizona 8. Nevada 9. Georgia 10. Wyoming |
41. Rhode Island 42. Oregon 43. Montana 44. Connecticut 45. New Jersey 46. Minnesota 47. California 48. Illinois 49. Vermont 50. New York |
Occasionally, certain preconceived notions about which states are economic powerhouses and are “dynamic” economies are betrayed by measurable economic facts. States like California and New York clearly have high levels of economic output and personal income, but this confuses incumbency with dynamic economic growth. While these levels remain fairly high, their measures of economic growth are slipping, fast.
The economic outlook ranking is a forward-looking measure of how well a state is projected to do economically in the future based on 15 equally weighted economic policy variables that have been shown to increase economic growth, both alone and together. That said, Indiana and North Carolina are new to the top ten economic outlook ranking this year and the policies that brought them there have not had a chance to fully take effect. So, while it isn’t an entirely fair comparison, let’s take a look at economic performance of the top ten economic outlook states versus the bottom ten economic outlook states:
|
Economic Performance (2002-2012; Cumulative) |
Top Ten States (Average) |
Bottom Ten States (Average) |
|
Gross State Product Growth |
65.2% |
45.7% |
|
Absolute Domestic Migration |
2,220,779 |
-411,176 |
|
Non-Farm Payroll Employment Growth |
11.1% |
1.8% |
States that rank high in terms of economic outlook vastly outperform the states that rank poorly for economic outlook. That gap will continue to widen when more time is given for these economic policies to mature. Despite the growth engines of New York City and Silicon Valley, states like New York and California are not performing as well as they once did.
The contrast becomes even clearer when one analyzes the patterns of people voting with their feet over time. People will look for economic opportunities and will move to places where they can find those opportunities. As the table above shows, states in the top 10 Rich States, Poor States Economic Outlook Ranking have gained 2.2 million citizens over the last decade, while the bottom 10 states have lost 400 thousand. Since 1960, New York has lost 14 congressional seats. In the 2010 census, for the first time since it became a state, California failed to pick up a new congressional seat. Internal Revenue Service Data from 1992 to 2010 shows that California has lost a total of $45.27 billion in adjusted growth income to other states while New York lost $68.1 billion.
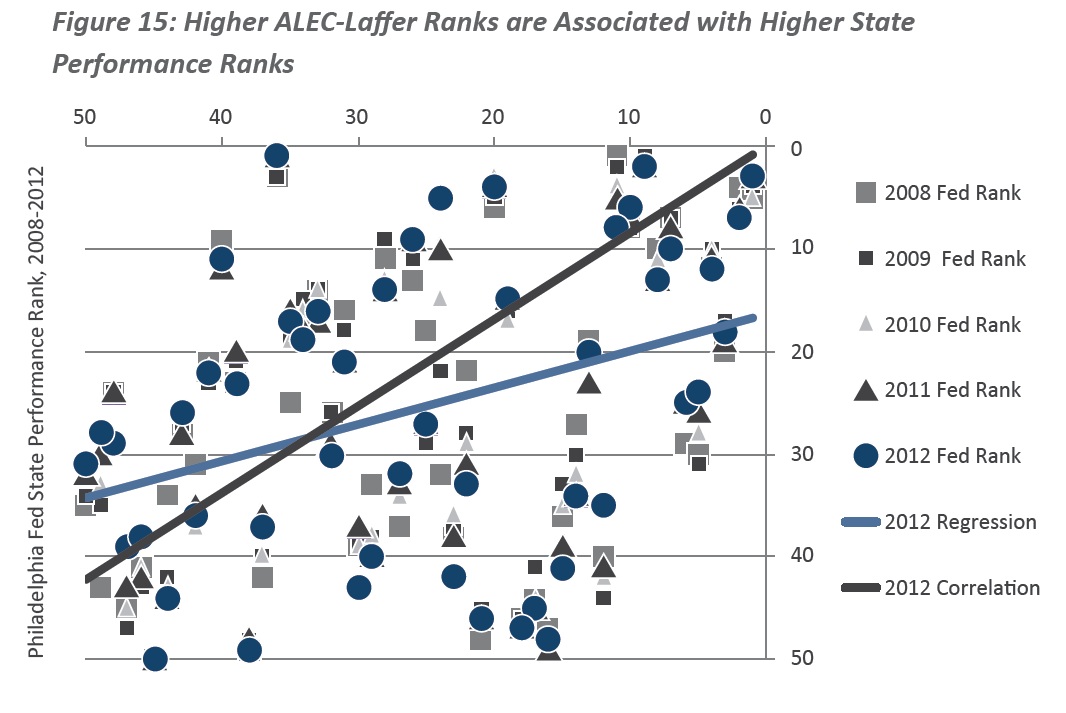
As a more technical aside, analysis from economists Dr. Eric Fruits and Dr. Randall Pozdena found a strong correlation between ranking high in economic outlook and strong future economic performance. The chart below shows the correlation measured based on several years of economic outlook rankings and economic performance metrics put together by the Philadelphia Federal Reserve.

