
For Economic Opportunity, the Redder the Better
Digging deeper for policy pay dirt
Many of America’s bluest states are deep in the red thanks to tried-and-failed progressive policies. The Illinois General Assembly can’t pass a long-term budget deal, leading to significant losses in state investment revenue, according to the state’s Treasurer. Despite encouraging rhetoric from Governor Dannel P. Malloy earlier this year, Connecticut is still in dire fiscal straits, and its anti-business policies have led to a struggling economy. According to soon-to-be released research from State Budget Solutions, California’s total unfunded state pension liabilities are larger than the entire economy of Indonesia (a nation of more than 250 million people). Therefore, when the New York Times publishes an op-ed titled “The Path to Prosperity Is Blue,” it is sure to raise some eyebrows.
At first blush, even discussing policy ideas in terms of “red” and “blue” seems unnecessary. In truth, the use of red and blue are less akin to marking political leanings than they are a proxy for underlying policy positions. The op-ed, attempting to paint the narrative that the fiscal responsibility often associated with red states is, in fact, irresponsible, contains the following:
Red states dominated by Republicans embrace cut and extract. Blue states dominated by Democrats do much more to maintain their investments in education, infrastructure, urban quality of life and human services — investments typically financed through more progressive state and local taxes. And despite what you may have heard, blue states are generally doing better.
Curious, then, that although these states are supposedly doing well and providing top-notch government services, individuals are more than happy to exit them for other, perhaps redder states en masse. As measured in the annual Rich States, Poor States: ALEC-Laffer State Economic Competitiveness Index, between 2005 and 2014, Illinois, Connecticut and California saw combined net domestic outmigration of more than 2 million. The authors argue “economic performance is measured in the lives of individuals, not aggregates.” If economic prosperity in blue states is so abundant and apparent, it begs the question, “why are those individuals leaving?” The simple answer is that red states generally offer more economic freedom and more growth potential, both for the state and the individual.
Seemingly aware that flagship blue states are in trouble, the authors attempt to undercut the issue by stating that free marketers tend to “cherry-pick a handful of red states with decent records and contrast them with the most troubled blue states.” This rhetorical flourish may seem clever, but it does little to raise Illinois’ bond rating, increase Rhode Island workers’ lackluster wage gains, or reverse a decade-long dip in Vermont’s labor force participation.
Personal Income Growth Rate, Rhode Island

Source: Bureau of Economic Analysis, Rhode Island Fact Sheet
The article’s authors chose arguably flawed metrics of success: median income, life expectancy, taxation of the top one percent, patent rate and percentage of adults aged 25 or older with at least a bachelor’s degree. Deeply implied by these measures is that only a certain strain of worker is truly successful in America: erudite, white collar scientists and engineers. This overt preference for one type of economic activity is why so many states are wasting millions of taxpayer dollars on programs like START-UP NY, which has cost New York taxpayers $130,000 per job in ad spending alone. There are infinitely more ways for an individual to get ahead in America than the handful of occupations divined by unelected bureaucrats to be the “next big thing.” Red states that recognize this fact have lowered barriers, evened the playing field and allowed more room for private sector growth than centrally-planned blue states.
The free market argument belies a much different underpinning: individuals don’t need to be forced, or even nudged, into a preferred field. Individuals will, more often than not, make the correct choice for themselves. Therefore, the best socio-economic system to fit that assumption is one that levels the playing field as much as possible, rather than selecting and suggesting ideal professional paths.
Some of the other metrics, beyond just their implications, are also imperfect on their face. Life expectancy is admittedly satisfactory shorthand for determining a nation’s development. However, to compare life expectancy between American states shows the difference between the best state, Hawaii, and the worst state, Mississippi, is roughly equivalent to the difference between Singapore and Denmark – at a certain point, the comparisons aren’t all that illuminating.
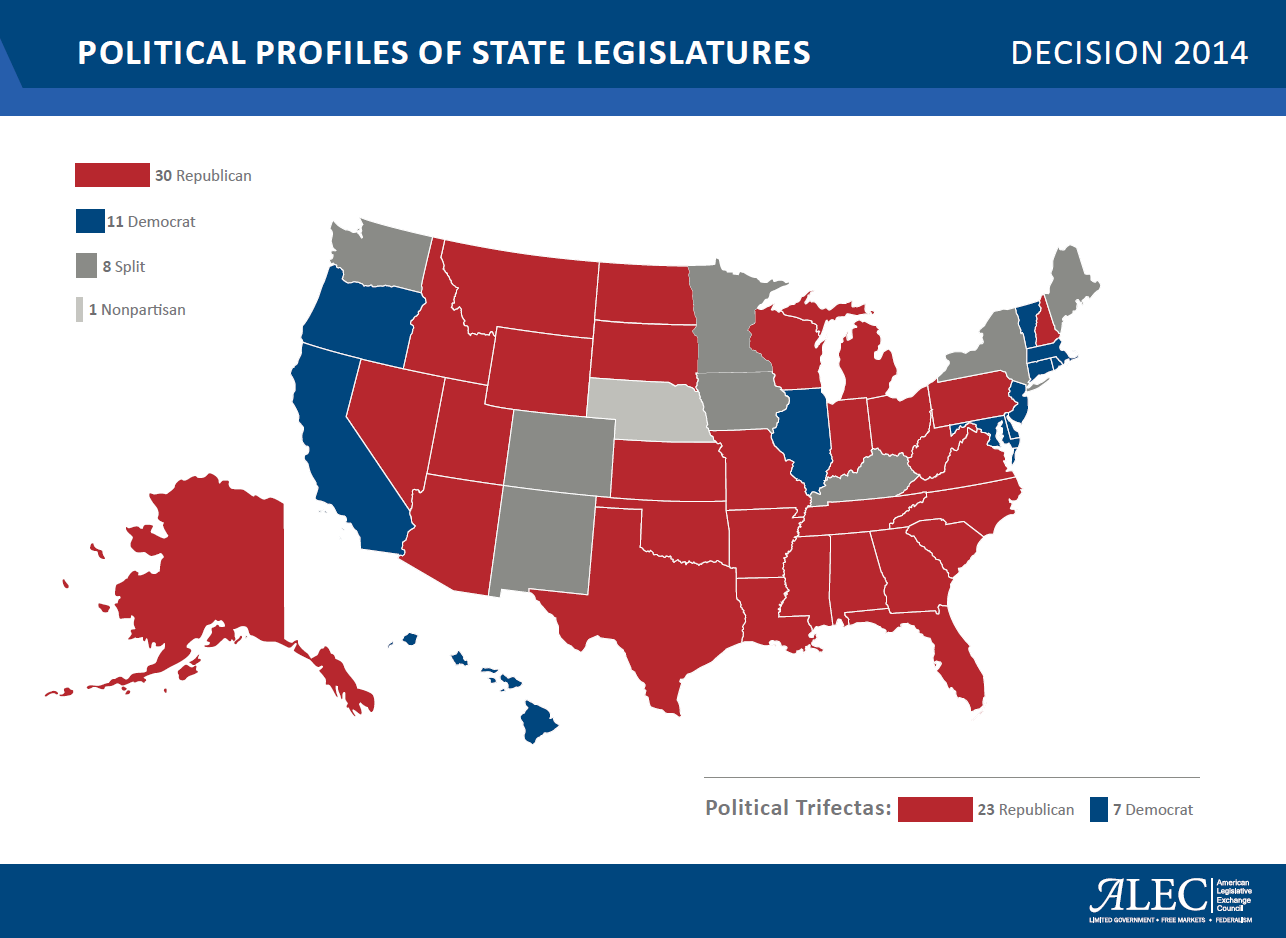
Most concerning, though, is how “blue state” is defined. The authors chose to identify states as red or blue based on whether they had supported one major party’s presidential nominee for four consecutive cycles. A thoroughly flawed approach, identifying states based solely on the presidential ballot ignores one of the greatest impacts on a state: its legislature. Therefore, it would be far more accurate to break down the lines of red and blue along control of the state legislature. That said, statewide elected officials in the executive branch also have strong impacts on state policy, and often a blue presidential state will be a red gubernatorial state.

Since the Times op-ed used median income from the year 2014, it would be appropriate to examine statehouse makeup in the same year. In 2014, 30 state legislatures were held by Republican majorities in both houses and 11 were completely controlled by Democrats. In that year, clear lines in gross state product growth rates exist: red state economies grew an average of more than 27 percent faster than blue states. Additionally, in 2014, year over year wage growth rates in red states outpaced blue states by more than 5 percent. Beyond merely having faster wage growth, recent Tax Foundation research shows that in 2014, individuals living in red states enjoyed much greater value for their dollars than those living in blue states. In short, red state policies are better for both the state economy and the individual.
The Times op-ed levies a charge against pro-growth economists like Stephen Moore, saying they rely too heavily on raw growth of a state economy’s size, but the figures above reflect growth rates, thus evening out gains produced from raw population gains. Of course, is it even a fair argument to discount growth from population gains altogether? The fact that more individuals move from blue states to red is, in fact, an indicator of economic opportunity in and of itself.
When it comes to comparing red states to blue ones, the questions relating to political party are far less important than the ones relating to their policies. States like Michigan and Wisconsin may have gone blue in every presidential election since 1988 and ’84, respectively, but since then they have passed significant pension reforms and granted enhanced worker freedom. Florida may have swung for President Obama twice, but its pro-taxpayer and business-friendly tax system have made it a commercial hub for the East Coast. Thanks to a commitment to pro-growth, limited government principles, red states don’t pick winners and losers. They offer enhanced economic opportunity by rewarding all hard work.